
Market Snapshot – Broadening Equity Leadership, Asia Leads, Rand Firms as SA Yields Fall
January delivered a constructive start to 2026, with equity returns continuing to broaden beyond U.S. mega-cap technology—supporting the case for regional diversification. Despite a volatile newsflow backdrop and elevated geopolitical tensions early in the month, investor risk appetite improved, lifting most equity markets while bond markets made more limited progress.
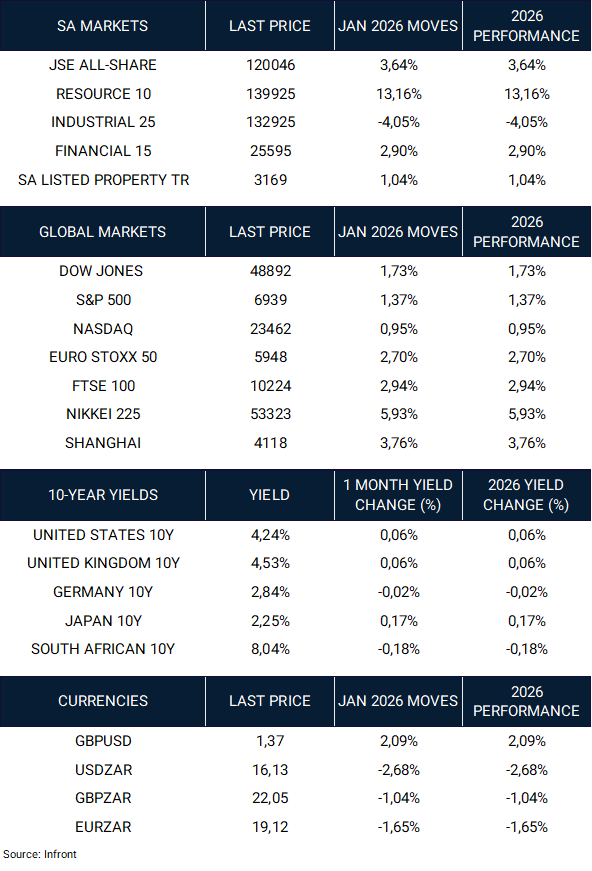
South African assets started the year positively. The FTSE/JSE All-Share rose 3.64%, led by a strong rebound in resources (Resource 10 +13.16%) and positive gains from financials (+2.90%). Industrials lagged (-4.05%), while listed property delivered a modest positive return (+1.04%), aided by a further decline in long bond yields. The rand strengthened meaningfully, with USD/ZAR down 2.68% to 16.13, reinforcing supportive domestic financial conditions.
Globally, equities were broadly higher. The Dow Jones (+1.73%), S&P 500 (+1.37%) and Nasdaq (+0.95%) advanced modestly, while Europe outperformed (Euro Stoxx 50 +2.70%, FTSE 100 +2.94%). Asia was a standout, with the Nikkei 225 up 5.93% and the Shanghai Composite up 3.76%, consistent with improving sentiment and a broadening of leadership across regions.
Key Trends in December:
- Broadening equity leadership: performance extended beyond U.S. mega-cap technology, with stronger relative returns in Europe and Asia.
- Risk appetite improved despite volatile headlines, supported by a “Goldilocks-like” mix of firmer activity data and moderating inflation prints.
- Rates diverged: developed-market yields were modestly higher in aggregate, while South African long yields fell meaningfully, supporting local rate-sensitive assets.
- The rand strengthened as the dollar softened, reinforcing improved domestic financial conditions.
United States – Positive Month, Broader Participation
Equity Performance:
- Dow Jones: +1.73%
- S&P 500: +1.37%
- Nasdaq: +0.95%
U.S. equities opened the year with moderate gains, but the market narrative was less about index-level strength and more about rotation beneath the surface. Your broader January notes highlight that leadership has continued to broaden away from a narrow cluster of large-cap technology stocks—an important development after periods where returns were concentrated. This “broadening” is typically supportive for portfolio construction, as it reduces reliance on a single theme or segment of the market.
From a macro perspective, the month’s tone was supported by activity data that generally held up and inflation prints that moderated, reinforcing the view that real income growth can remain supportive for consumers. Against that, bonds were more hesitant, reflecting some push-back in front-end rates as expectations for rate cuts were pushed further out.
Outlook: The U.S. remains supported by earnings resilience, but with rates still a meaningful driver of equity style dispersion, selectivity and diversification remain key. In this environment, portfolio outcomes often improve when exposure is spread across regions and factors, rather than relying on a single leadership cohort.
Europe – Stronger Month, Supportive Relative Dynamics
Equity Performance:
- Euro Stoxx 50: +2.70%
- FTSE 100: +2.94%
European equities outperformed U.S. benchmarks in January, consistent with the global broadening theme and improved risk appetite. Europe’s stronger start is also consistent with the idea that earnings growth and equity leadership may be more evenly balanced across regions in 2026, rather than concentrated in one market.
In your broader notes, geopolitical sensitivity played a role in relative winners and losers during the month, with certain “geopolitics-linked” exposures reacting more strongly. Even so, the headline takeaway remains that Europe participated meaningfully in the global equity advance, reinforcing its role as a diversification anchor within global equity allocations.
Outlook: Europe continues to offer valuable diversification due to different sector composition and market drivers versus the U.S. Maintaining exposure helps reduce concentration risk and improves the resilience of global equity allocations.
Japan – Standout Equity Performance Amid Rate Volatility
Equity Performance:
- Nikkei 225: +5.93%
Japan was one of the standout performers globally in January, with the Nikkei delivering a strong gain. This aligns with your broader narrative that Japan’s equity market benefited from the ongoing rotation away from U.S. concentration, as well as improving sentiment toward Asian opportunities more broadly.
At the same time, your narrative highlights an important nuance: Japanese bond markets experienced a difficult start to the year, reflecting fiscal concerns and steepening dynamics. That matters because Japanese rates can influence the yen and broader global rate expectations—both of which can feed back into equity multiples and risk appetite.
Outlook: Japan remains an attractive structural allocation within global equities, but after a strong move, returns may be more two-way and sensitive to shifts in yields and currency dynamics. The bigger picture remains constructive: Japan provides differentiated exposure within a diversified global equity book.
China – Mainland Markets Firmer, Dispersion Remains
Equity Performance:
- Shanghai Composite: +3.76%
Chinese mainland equities started the year positively, consistent with improved sentiment and the broader Asian bid. Your extended January notes also reinforce the ongoing reality of dispersion: opportunities exist, but sector composition and policy direction remain critical for returns.
Outlook: China remains a market where outcomes are highly path-dependent on policy, reform direction and domestic demand dynamics. It continues to warrant selective exposure rather than broad, undifferentiated positioning.
South Africa – Resources Drive Performance as Financial Conditions Improve
Equity Performance:
- JSE All-Share: +3.64%
- Resource 10: +13.16%
- Industrial 25: -4.05%
- Financial 15: +2.90%
- SA Listed Property TR: +1.04%
South African equities started 2026 well, with resources decisively leading returns and financials contributing positively. Industrials lagged, reflecting both global growth sensitivities and the reality that the JSE’s industrial complex is often more exposed to offshore earnings translations and global demand dynamics.
Crucially, the macro/financial backdrop was supportive: the rand strengthened significantly and SA 10-year yields declined to 8.04% (down 0.18% on the month)—a constructive combination that tends to lower the discount rate for domestic assets and support rate-sensitive exposures such as listed property and financials.
Outlook: South Africa remains supported by attractive real yields and commodity leverage, but as always, local assets remain sensitive to shifts in global risk appetite. The strong start to 2026 supports staying invested, but with disciplined sizing and balanced offshore diversification.
Currencies – Softer Dollar Tailwind, Rand Strength Continues
Key Moves:
- GBP/USD: +2.09% (to 1.37)
- USD/ZAR: -2.68% (to 16.13)
- GBP/ZAR: -1.04% (to 22.05)
- EUR/ZAR: -1.65% (to 19.12)
Currency moves reinforced a constructive EM tailwind: the rand strengthened meaningfully against the dollar and also advanced against the euro and sterling. A softer dollar environment typically supports commodities and EM assets—both relevant for South Africa.
Commodities – Supportive Backdrop, Risk Hedge Remains Relevant
Your broader January inputs highlight strong commodity performance early in the year, with gold and energy responding to a combination of geopolitical risk and tightening seasonal supply/demand dynamics. In portfolio terms, the key point is less about precise month-to-month commodity calls and more about role clarity: commodities and gold can be effective shock absorbers when geopolitical risk rises and markets experience volatility spikes.
Fixed Income – Developed Market Yields Firm, SA Yields Fall Further
10-Year Benchmark Yields (End-Jan | MoM change):
- United States: 4.24% | +0.06%
- United Kingdom: 4.53% | +0.06%
- Germany: 2.84% | -0.02%
- Japan: 2.25% | +0.17%
- South Africa: 8.04% | -0.18%
January reflected dispersion across sovereign bond markets. Developed-market yields were modestly higher overall, consistent with firmer activity data and a reassessment of the timing of rate cuts. Japan saw a larger move in yields relative to peers. By contrast, South African yields declined, reinforcing the constructive local fixed income backdrop and supporting domestic, rate-sensitive asset classes.
Final Thoughts – Broadening Supports Diversification, Stay Balanced and Disciplined
January’s message is constructive: equity leadership continued to broaden beyond U.S. technology, with stronger participation from Europe and Asia, while South Africa benefited from a strong resources rally, a firmer rand and falling long bond yields. At the same time, bonds were a reminder that the “carry” component matters more than relying on capital gains, particularly in markets where growth resilience delays the easing cycle.
What this means for portfolios:
- Avoid concentration risk: maintain exposure to global growth, but diversify across regions and sectors.
- Stay regionally diversified: Europe and Asia contributed meaningfully, consistent with a broader 2026 opportunity set.
- Retain quality bond exposure: local SA bonds remain valuable for real yield and diversification; DM curves remain more rate-sensitive.
- Keep diversifiers in the mix: gold and alternatives can improve resilience during geopolitical volatility.
Market Moves of the Month
The information contained in this recording/presentation is for general information purposes only and should not be construed as, nor does it constitute financial, tax, legal, investment or any other advice. Carrick does not guarantee the suitability or potential value of any products or investments discussed herein. We make no representations or warranties of any kind, express or implied, about the completeness, accuracy, reliability, suitability or availability with respect to the information, products, services, or any other content contained in this recording for any purpose. Carrick accepts no responsibility for the suitability or accuracy of the information or for any errors or omissions that may occur. Therefore, any reliance you place on such information is strictly at your own risk. This material is provided for general information purposes only and is not personal advice to anyone to invest in any fund or product. Information taken from trade and other sources is believed to be reliable, although Carrick does not represent this as accurate or complete and it shouldn’t be relied upon as such. All material, content, and information provided by Carrick is the intellectual property of Carrick Group and its affiliates, unless otherwise stated. No part of this material may be copied, reproduced, distributed, published, or used for any commercial purpose without Carrick’s prior written consent, and is provided solely for non-commercial use. Capital is at risk. The value and income from investments can go down as well as up and are not guaranteed. An investor may get back significantly less than they invest. Past performance is not a reliable indicator of current or future performance and should not be the sole factor considered when selecting an investment.