


In this Edition:
US LABOUR MARKET COOLS AS EQUITIES ADVANCE
Softer payroll growth and easing manufacturing cost pressures supported expectations for a less aggressive Fed path, while U.S. equities ended the week higher.
EUROPEAN INFLATION EASES AS GROWTH REMAINS UNEVEN
Lower eurozone inflation and steady UK growth supported sentiment, although household income pressures and above-target inflation remain important considerations.
ASIAN MARKETS GAIN AS CHINA DATA SHOWS RESILIENCE
China’s manufacturing data remained expansionary and regional equities advanced, while yen volatility continued to reflect interest rate and fiscal concerns in Japan.
SOUTH AFRICA’S MANUFACTURING SECTOR LOSES MOMENTUM
Local manufacturing activity weakened in June, though broader private sector resilience, rand strength and gains in resource stocks supported the domestic market.
MARKET MOVES OF THE WEEK
Source: Infront (04 July 2026)
CHART OF THE WEEK
Source: NBC News Analysis of Bureau of Labor Statistics, Bureau of Labor Statistics via FRED (04 July 2026)
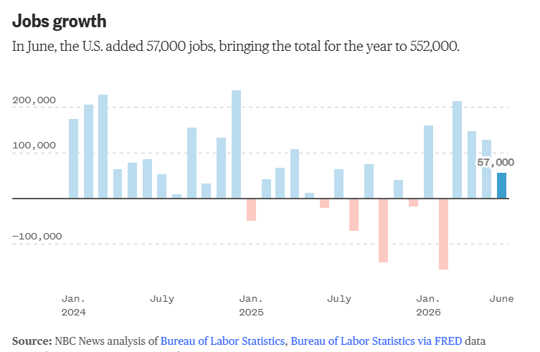
U.S. job growth slowed sharply in June, reinforcing signs of a cooling labour market and supporting expectations for a less aggressive monetary policy tightening cycle.
US labour market cools as equities advance
US job growth slowed sharply in June, with nonfarm payrolls increasing by 57,000, well below expectations of 110,000. Payroll figures for April and May were also revised down by a combined 74,000, reinforcing signs of a cooling labour market. Although the unemployment rate edged down to 4.2%, the decline was largely driven by lower labour force participation rather than stronger hiring. The softer labour market led markets to scale back expectations for a September interest rate hike while continuing to price in no change at the Federal Reserve’s July meeting.
Separately, the Institute for Supply Management (ISM) reported that its Manufacturing Purchasing Managers’ Index (PMI) eased to 53.3 in June from 54.0 in May, below market expectations. Despite the decline, the index remained above the 50-point mark for a sixth consecutive month, signalling continued expansion in manufacturing activity. While new orders and production moderated, the sharp decline in the prices paid index pointed to easing cost pressures.
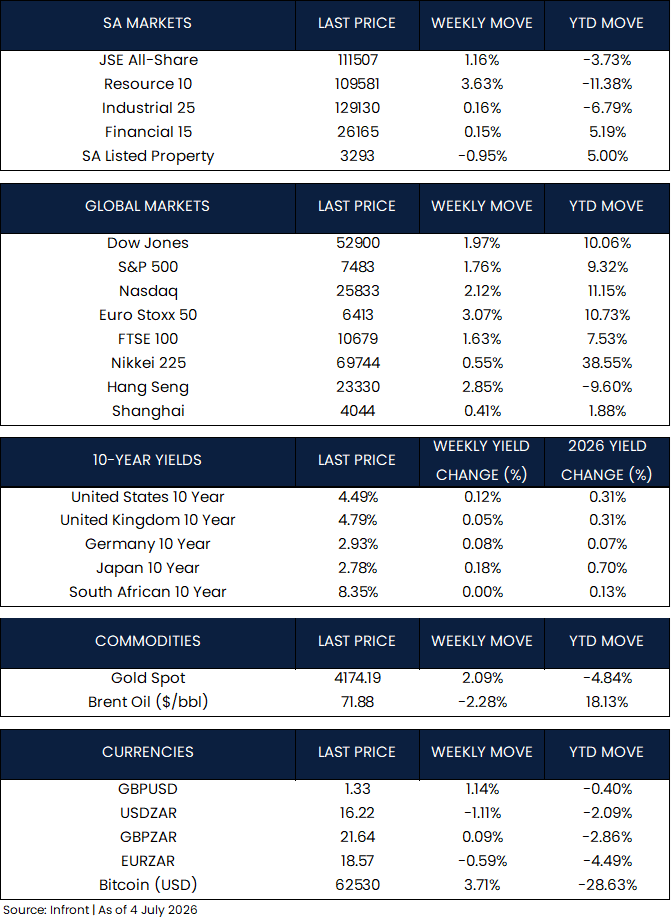
U.S. equity markets ended the holiday-shortened week higher, with the Nasdaq Composite gaining 2.12%, the Dow Jones Industrial Average rising 1.97%, and the S&P 500 advancing 1.76%.
European inflation eases as growth remains uneven
According to Eurostat, annual eurozone inflation eased to 2.8% in June from 3.2% in May, below market expectations. Lower oil prices helped moderate inflationary pressures, while core inflation, which excludes volatile food and energy prices, slowed to 2.4%. Services inflation, a closely watched gauge of underlying inflationary pressures, also eased to 3.2% from 3.5%. Although inflation remains above the ECB’s 2% target, ECB President Christine Lagarde said the central bank no longer needs to respond to inflation with the same force as during the 2022–23 inflation shock.
Meanwhile, the Office for National Statistics (ONS) confirmed that the UK economy expanded by 0.6% in the first quarter of 2026, in line with previous estimates. Growth was driven by the services sector, although real household disposable income declined by 0.8%, highlighting continued pressure on household finances.
European equities also posted solid gains, with the STOXX Europe 50 Index rising 3.07% as lower oil prices and easing inflationary pressures supported investor sentiment, while the UK’s FTSE 100 added 1.63%.
Asian markets gain as China data shows resilience
The Japanese yen remained volatile, weakening to around JPY 162.5 per U.S. dollar, its weakest level in nearly 40 years, before rebounding on speculation that Japanese authorities could intervene in the foreign exchange market. The yen continues to face pressure from the wide U.S.-Japan interest rate differential, alongside concerns over Japan’s fiscal position and higher energy prices.
China’s June PMI data pointed to continued resilience in the manufacturing sector despite broader economic headwinds. The official Manufacturing PMI rose to 50.3 from 50.0 in May, supported by stronger production, new orders and high-tech manufacturing, while the Non-Manufacturing PMI edged up to 50.2. The private RatingDog Manufacturing PMI eased marginally to 51.7 from 51.8, remaining in expansionary territory. Overall, the data highlighted an uneven recovery, with high-tech manufacturing continuing to outperform more domestic demand-sensitive sectors.
Global equity markets ended last week higher as easing geopolitical tensions, lower oil prices and resilient economic data supported investor sentiment.
In Japan, the Nikkei 225 rose 0.55% over last week, rebounding sharply on Friday after earlier losses driven by profit-taking in technology and semiconductor stocks.
In China, the Shanghai Composite Index gained 0.41%, while Hong Kong’s Hang Seng Index rose 2.85%, supported by better-than-expected manufacturing data and improved short-term liquidity conditions.
South Africa’s manufacturing sector loses momentum
South Africa’s manufacturing sector lost momentum in June, with the Absa Manufacturing PMI falling to 47.3 from 50.8 in May, signalling a return to contraction. Weaker demand weighed on new orders, although some businesses reported customers delaying purchases in anticipation of lower prices following recent fuel price cuts. In contrast, the S&P Global PMI rose to 50.5 from 49.6, suggesting broader private sector activity remained resilient.
Local equity markets strengthened over the last week, mirroring global market trends. The JSE All Share Index rose 1.16%, driven by a strong recovery in resource stocks, which gained 3.63%. Industrials (+0.16%) and financials (+0.15%) were broadly flat, while listed property was the only sector to decline, falling 0.95%. The rand strengthened against the U.S. dollar, ending last week at R16.22/$
The information contained in this recording/presentation is for general information purposes only and should not be construed as, nor does it constitute financial, tax, legal, investment or any other advice. Carrick does not guarantee the suitability or potential value of any products or investments discussed herein. We make no representations or warranties of any kind, express or implied, about the completeness, accuracy, reliability, suitability or availability with respect to the information, products, services, or any other content contained in this recording for any purpose. Carrick accepts no responsibility for the suitability or accuracy of the information or for any errors or omissions that may occur. Therefore, any reliance you place on such information is strictly at your own risk. This material is provided for general information purposes only and is not personal advice to anyone to invest in any fund or product. Information taken from trade and other sources is believed to be reliable, although Carrick does not represent this as accurate or complete and it shouldn’t be relied upon as such. All material, content, and information provided by Carrick is the intellectual property of Carrick Group and its affiliates, unless otherwise stated. No part of this material may be copied, reproduced, distributed, published, or used for any commercial purpose without Carrick’s prior written consent, and is provided solely for non-commercial use. Capital is at risk. The value and income from investments can go down as well as up and are not guaranteed. An investor may get back significantly less than they invest. Past performance is not a reliable indicator of current or future performance and should not be the sole factor considered when selecting an investment.